Τετάρτη, Ιανουαρίου 31, 2007

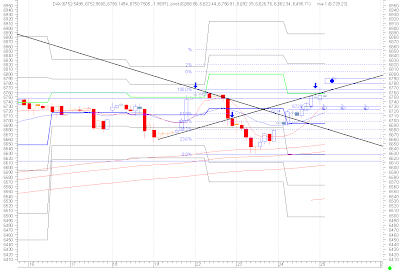
ΓΕΝΙΚΟΣ ΔΕΙΚΤΗΣ Elliott 30-01-2007


Στο τελευταίο σχόλιο ζήτησα η δυνατά κλεισίματα πάνω απο 4700 για να πάμε στους ψηλότερους στόχους η διαφορετικά θα διανύσουμε σωρευτική περίοδο και αναμονή πρίν την επιλογή της κατεύθυνσης.


Έχει επιλέξει το δεύτερο.


Πατάτε διάγραμμα να μεγαλώσει.

Τρίτη, Ιανουαρίου 30, 2007

International Equities-Procter & Gamble lifts markets

Procter & Gamble Co. on Tuesday raised its fiscal 2007 earnings outlook to a range of $2.99 to $3.03 a share, up from a prior target of $2.97 to $3.02. Analysts' average estimate stands at $3.02 a share, according to Thomson Financial. Organic sales, or sales excluding acquisitions, divestitures and currency exchange, are expected to grow 5% to 6%, up from a prior expectation of 4% to 6%. P&G, of Cincinnati, also set a third-quarter earnings target at 72 cents to 74 cents a share.

The Chicago Mercantile Holdings Inc. said fourth-quarter earnings for the three months ended Dec. 31 rose 35% to $103 million, or $2.91 a share from $76.3 million, or $2.18 a share in the year-ago period. Revenue climbed to $281.3 million from $222.5 million. Analysts surveyed by Thomson First Call forecast earnings of $2.98 a share and revenue of $286.9 million, on average. The company's purchase of the Chicago Board of Trade is expected to close in the middle of the year.

The Pepsi Bottling Group Co. said its fourth-quarter net profit rose 80% to $133 million, or 55 cents a share, from $74 million, or 30 cents a share. Revenue rose 2.8% to $3.77 billion. The company said it benefited from a 22 cents-a-share gain from the reversal of tax reserves and was also hit by a 5 cents-a-share expense from share-based payment charges. Analysts polled by Thomson Financial were expecting earnings of 32 cents a share on revenue of $3.75 billion. The company said revenue growth was driven by a 2% rise in worldwide physical case volumes, with revenue per case up 3%. Pepsi Bottling said it expects 2007 earnings to be in a range of $1.92 to $2.00 a share, excluding the impact of an accounting standard on uncertain tax positions. Analysts were expecting 2007 earnings of $1.97 a share on average. Worldwide case volumes are expected to grow 1% to 2% in 2007, the company added.

3M Inc. said fourth-quarter net income jumped 58% to $1.18 billion, or $1.57 a share, after a $354 million, or 47 cents a share, gain from selling its pharmaceutical business. Sales rose 9% to $5.78 billion, or up 6.5% in local currencies. Analysts polled by Thomson Financial expected earnings of $1.14 on revenue of $5.76 billion. The company expects 2007 earnings per share between $5.20 and $5.45 a share, or between $4.60 and $4.75 on an adjusted basis. The 2007 adjusted guidance includes 21 cents of stock option expenses. Analysts expected adjusted 2007 earnings of $4.99 a share.

Ftse-20 Σχόλιο Intraday

Ο εικοσάρης έχει αποκρουστεί απο το 2575.

Είναι αυτή την ώρα και πάλι στην στήριξη του 2535-40.

Αντίσταση κοντινή 2555.

Κάτω απο 2540 στο 2523.

Η Πίστεως πρέπει να κρατήσει το 24.50 next hours δαφορετικά θα επιβαρύνει αρνητικά την τεχνική της εικόνα.

Happy Trading and Good Hunting

Δευτέρα, Ιανουαρίου 29, 2007

Fractals and Chaos Theory

Απο τους κύριους εκφραστές και μέγιστος εργάτης στην απόδειξη της θεωρίας ο πολυβραβευθείς Μαθηματικός Dr. Benoit B. Mandelbrot .
===========
Major Books and Papers:
==========
1.
B.B.Mandelbrot, The Fractal Geometry of Nature, W.H.Freeman and Company (NewYork),1982.
2.
B.B.Mandelbrot, Fractals and Scaling in Finance: Discontinuity, Concentration, Risk, New York: Springer, 1997.
3.
B.B.Mandelbrot, Multifractals and 1/f Noise : Wild Self-Affinity in Physics, New York: Springer, 1999.
4.
B.B.Mandelbrot, Gaussian Self-Affinity & Fractals: Globality, the Earth, 1/f, & R/S, New York: Springer, 2002.
5.
M. L. Frame & B.B.Mandelbrot, Fractals, Graphics and Mathematical Education, Washington DC: Mathematical Association of America & Cambridge UK: The University Press, 2002.
6.
B.B.Mandelbrot, The variation of certain speculative prices. The Journal of Business of the University of Chicago: 36, 394-419. 1963.
7.
B.B.Mandelbrot, Random walks, fire damage amount, and other Paretian risk phenomena,Operations Research 12, 582-585, 1964.
8.
B.B.Mandelbrot, How long is the coast of Britain? Statistical self-similarity and fractional dimension, Science 155, 636-638, 1967.
9.
B.B.Mandelbrot, Some noises with 1/f spectrum, a bridge between direct current and white noise, IEEE Transactions on Information Theory 13, 289-298, 1967.
10.
B.B.Mandelbrot, A population birth and mutation process, I: Explicit distribution for the number of mutants in an old culture of bacteria, Journal of Applied Probability 11, 437-444, 1974.
11.
B.B.Mandelbrot, Intermittent turbulence in self-similar cascades; divergence of high moments and dimension of carrier, Journal of Fluid Mechanics, 62, 331-358, 1974.
12.
B.B.Mandelbrot, Stochastic models for the Earth's relief, the shape and the fractal dimension of the coastlines, and the number-area rule of islands, Proceedings of the National Academy of Sciences (USA) 72, 3825-3828, 1975.
13.
B.B.Mandelbrot, Fractal aspects of the iteration of z →λ z(1-z) for complex λ and z, Annals of the New York Academy of Sciences 357, 249-259, 1980.

Ftse-20 Daily Chart και Σχόλιο


Κύριο χαρακτηριστικό των δυό τελευταίων διορθωτικών συνεδριάσεων του εικοσάρη εκτός των στηρίξεων στις περιοχές σηματωρούς πέριξ του 2540 και τα προσεκτικά κλεισίματα.
Και στις δυό φορές το κλείσιμο έγινε πάνω απο το 2550 , που έχουμε ζητήσει να διαφυλαχτεί για να επέλθει η διάσπαση του υψηλού και τα νέα υψηλά.
Ο εικοσάρης για μεγάλο χρονικό διάστημα κινείται με '' κατοστάρες ΄΄.
Δηλαδή παίρνει 100 πόντους , συσσωρεύει τους κατοχυρώνει και τους χωνεύει η αγορά και μεταθέτει τον στόχο στους επόμενους 100.

Θυμηθείτε 2305-2404-2505 και τώρα 2591 ( σχεδόν 2600).

Οπότε να σταθούμε σε παρατήρηση τυχόν κλεισίματος κάτω απο 2550 για αρνητικές προδιαθέσεις και σε υπέρβαση κατ' αρχήν του 2580 να προετοιμαζόμαστε για τους επόμενους στόχους σαν το 2605 και μετά αν κατοχυρωθεί αυτό η επόμενη 100άρα στο 2704.

πατάμε το διάγραμμα να μεγαλώσει.

Ftse-20 Σχόλιο

Όπως είδαμε και στο intraday γράφημα της Παρασκευής ο δείκτης εξακολουθεί να στηρίζεται γύρω απο την περιοχή 2535 και να βρίσκει εμπόδιο τώρα στην αντίστοιχη του 2580.

Περνώντας απο αυτήν η επόμενη κοντινή αντίσταση είναι στα 2610.

Η προσοχή μας και πάλι στην συμπεριφορά της ΕΤΕ γύρω απο τα 40.00 υπέρβαση των οποίων , θα στείλει τηνμετοχή στην κεφ/ση στόχο των 42 ευρώ περίπου.

Στήριξη εκτός του βασικού 37.20-37.30 στα πιο κοντινά το 38.50-38.80.

Μετά τις αλλαγές στο ΔΣ και η μετοχή της ΔΕΗ φαίνεται να αφυπνίζεται και να τίθεται αρωγός στην ανοδική κίνηση του 2οάρη και το 22.20 είναι αυτή τη στιγμή το σημείο κλειδί της.

Γενικός Δείκτης - 26-01-2007


Ο Γενικός Δείκτης παρά το ενδοσυνεδριακό rebound της Παρασκευής πρέπει να αντιμετωπίζεται επιφυλακτικά , όσο δεν πραγματοποιεί δυνατά κλεισίματα πάνω απο 4700.

Θα θεωρείται πως διανύει διορθωτική σωρευτική περίοδο , που μπορεί να βγάλει και μέχρι το 4560.

Με την πρώτη προϋπόθεση εκπληρωμένη η τάση θα συνεχιστεί πρός το 4934 και κυρίως 5001.
Δείτε το διάγραμμά του σε μεγέθυνση πατώντας πάνω στην εικόνα.

Κυριακή, Ιανουαρίου 28, 2007

VOLUME BREAK-UP-Counting-Swing-UPDATE


Πρίν τέσσερις μόλις μέρες στο σχόλιο :
http://dimigon-analysis.blogspot.com/2007/01/volume-break-up-counting-swing.html


Επισημάνθηκε με απλές τεχνικές μεθόδους το timing στην μετοχή της Quest.


Η συνέχεια δικαίωσε την τεχνική μέθοδο.


Press updating chart to be enlarged.

DOW JONES INDUSTRIAL


Ο βασικός αμερικανικός δείκτης και επηρεάζων σε μεγάλο βαθμό και τις υπόλοιπες αγορές διανύει μια κατ΄αρχάς δευτέρου βαθμού διορθωτική περίοδο.


Η αριθμοποίηση της τρέχουσας βραχείας τεχνικής του κατάστασης είναι η εξής :


Για να αποκτήσει νέα ανοδική δυναμική πρέπει να φύγει πάνω απο 12560.


Είναι σήμερα 12487.


Το 12400 είναι πρώτη κύρια περιοχή στήριξής του.


Σπάζοντάς το πάει στο 12250 κάτω απο το οποίο η διόρθωση θα λάβει εκτενέστερου βαθμού χαρακτηριστικά.


press chart to enlarge.

euro-Us Dollar--


Την Παρασκευή και ενώ κατευθύνετο προς την γραμμή λαιμού τουλάχιστον στην περιοχή του 1.2850 μαζεύτηκε σχετικά νωρίτερα και έκλεισε απο όψιμους αγοραστές και υποστηρικτές πάνω απο την σημανική περιοχή του 1.2920 οριακά.


Στο σημερινό ζουμαρισμένο διάγραμμα διακρίνουμε πως μας έχει δώσει ενα bearish ανοδικό καναλάκι , που πρός στιγμήν είχε θεωρηθεί πως θα το πήγαινε μέχρι το 1.3100 αλλά γύρισε νωρίτερα απο το 1.3044.


Στη συνέχεια αυτό έχει σπάσει πτωτικά και τα pull backs του είναι στο 1.2950 και 1.2970.


Αυτά τα δυό είναι σημεία πρίν το 1.3000 που το ευρώ μπορεί να σορταριστεί .


Και πάλι με διάσπαση του 1.3000 θα στοπαριστεί και θα αναστραφεί η θέση.


Έχουμε ακόμα στη διάθεσή μας μια σπουδαία γραμμή την 2-4 απο τα ψηλά στο 1.3044 , η οποία όσο παραμένει αδιάσπαστη θα θεωρούμε το 5 πως είναι σε εξέλιξη για την περιοχή του 1.2750.


Αν σπάσει και περάσει και το 1.3000 θα αλλάξουμε σκεπτικό.


Μέχρι τότε πρέπει να κινούμεθα με τα pull backs shorting.


Press chart to enlarge.

Παρασκευή, Ιανουαρίου 26, 2007

Trading Education newsletter

http://www.tradingeducation.com/newsletter/

FTSE-20 60 MINUTES CHART


SOME MINUTES BEFORE CLOSING AT 16.15 P.M.

FTSE-20 REBOUNDING FROM SUPPORT 2540 REACHES MAIN AREA OF BREAKING OR NOT.

==


Press Chart to Enlarge.

FDAX- Trading in 60minutes Chart-UPDATE-No 2


Last updating Fdax 60minutes Chart at 15.00 local Greek time, 30 minutes before the news.
Press Chart to Enlarge.
===========


Jan 26
08:30
Durable Orders
Dec
7.0%
3.5%
1.6%
Jan 26 press chart to enlarge
10:00 Press Chart to Enlarge
New Home Sales
Dec
1055K
1050K
1047K

EURUSD DAILY CHART UPDATE


Update the same chart daily as previous.

Upmovement didn't reach the break target 1.3100 and approach only the 38er retrc to 1.3040.

Sequently the setup long 1.2970 failed.

Right now has moved to the main support area 1.2900 about as in the chart plotted and break of that will assume bearish consequences.


'' Press chart to enlarge ''

FDAX- Trading in 60minutes Chart-UPDATE


It is 12.00 o'clock local Greek Time.


You can see FDAX Diagram moving as scheduled in my chart.


Press chart to enlarge please.

FDAX- Trading in 60minutes Chart


Ενα διάγραμμα σε ωριαία βάση σήμερα του Fdax με περιοχές μείζονης σημασίας για πιθανή αναστροφή η συνέχιση της απο χτές εναρκτήριας κίνησης.

FTSE- Update Daily chart

press chart to enlarge.
================

===


Ο Εικοσάρης στην πρώτη του και πάλι επέκταση 2591/95 ανέκοψε την ανοδική του πορεία και εμφάνισε πωλητές πρόθυμους να υλοποιήσουν τα πρόσφατα κέρδη τους.


Αυτό έδειξε και το πρώτο στο 2591 ωριαίο κερί με τον μεγάλο όγκο και την σκιά πάνω και το επιβεβαίωσαν τα δυό ακολουθήσαντα.


Ο Δείκτης δείχνει πως ακόμα μια φορά θα μπεί σε δοκιμασία διόρθωσης κάτω απο το 2570/80 απο την ποιότητα και την χρονικότητα της οποίας καθώς και απο τα επίπεδα στα οποία θα στηριχτεί , θα κρίνουμε και την μεσοπρόθεσμη εικόνα του.


Και πάλι σε αυτή τη φάση θα πρέπει να παρακολουθούμε την συμπεριφορά της ΕΤΕ , η οποία έχει απο το 37.00 στα 40.00 συσσωρεύσει αρκετό '' λίπος '' για να κάψει προς προστασία του ftse-20.


Πρός το παρόν και κάτω απο 2570 θα δούμε την αντιδράσεις στο 2550 και 2535 και ανάλογα θα σκεφτούμε και συμπληρωματικά την ματιά στην ΕΤΕ και την διορθωτική πορεία , που τυχόν θα αναπτύξει.


Πατήστε στο διάγραμμα να μεγάλωσει. ( είναι το ίδιο το χτεσινό) σε ημερήσιο πάλι time frame.

Πέμπτη, Ιανουαρίου 25, 2007

Oil, Gold Erase Losses To Close Higher

By John Lee
Wednesday, Jan 24, 2007
U.S. Treasury bond prices traded fractionally lower today. The U.S. government sold $20 billion in 2-year notes today in an auction, which drew a yield of about 4.9%. Bond prices have been trading within a fairly tight range for the past two weeks, after falling steadily since the beginning of December. Bond prices usually fall on economic strength and rise during weakness. Bonds initially shot higher last June, when the Fed initiated a rate-pause on the grounds of slowing U.S. growth and moderating inflation. Bond prices moved consistently higher during the second half of 2006, on continued weak housing, confidence and other economic reports. However, the beginning of December saw a dramatic shift in housing numbers, as well as other consumer, sales and confidence indicators. Bond prices have been falling since the beginning of December when the turn-around reports started to appear. Speculators will be paying close attention to any future housing reports, which are used as key indicators to the broad economic health of a country.

The yen gained dramatically against the dollar and the euro today, on a Reuters report that suggested that a G-7 meeting next month could focus on the yen's recent declines. Extreme continued weakness in the yen has led global leaders to feel that the playing field is not balanced, which could lead to major disruptions and upsets in the currency market in the future. Investors have been selling the yen heavily against the dollar, euro and other foreign currencies on Japan's slow-growing economy. Sentiment across the board led to record lows against the euro and yearly lows against the dollar, but today's report by Reuters of international opposition to yen weakness led to a significant bounce off of those lows.

Crude oil closed with fractional change today. Crude prices reacted initially to rising inventories by selling off, but erased those losses to close barely green on the day. Crude stockpiles rose by about 750,000 barrels last week, and crude supplies are well-above their 5-year averages. Crude has fallen over 30% from record July highs, and OPEC has called for massive international output reductions to curb the falling prices. Just recently crude prices have turned around and started to push higher; price strength can be seen in crude's rebound after selling off on a strong inventory report. Natural gas fell nearly 3% on speculation that strong inventories could easily handle any spike in demand.

Gold erased early losses to close up fractionally today. Gold initially sold off with energy, and on relative dollar strength, but the late-day crude rally helped to spark gold buying. Gold usually trades inversely to the dollar and with oil, and it was oil action that lifted gold off the day's lows to close slightly green. Traders turn to gold as a safe-haven in the face of rising energy costs and dollar weakness. Copper prices continued to rise today, closing up nearly 1% on speculation that inventories have fallen in China.

Grains fell across the board after President Bush signaled last night that ethanol will not be the only source for alternative fuels, and that new sources aside from grains will be explored in coming research. Wheat fell nearly 3%, corn fell nearly 2% and soybeans fell just over 1.5%.

Economic News
No major U.S. economic news to report today.

COMMERCIAL BANK OF GREECE- Chart Update


============


Updating againg CBOG Chart after blog's friend request.

Press chart to enlarge.

Dax Trading Hourly Chart MoB's

Τα χτεσινά MoB's 6714 και 6725 ήτανε καίρια αφού και το πρώτο και το δεύτερο ταλαιπώρησαν τον Dax και έδωσαν αρκετές μονάδες στις κόντρες μέχρι να διασπαστούν στις 16.00 και να κάτσει και πάνω στο 25 αυτό το κερί.
Απο κει και πέρα ο δρόμος για τα υψηλά 6767/70 ήταν ανοιχτός και το κατάφερε και χτές το απ
απόγευμα μέσω του fdax και σήμερα το πρωί μαζί με τον Dax.
Στην συνέχεια και αυτή την ώρα στις 11.00 αναπτύσσει ενα διορθωτικό τεσσάρι που .. '' νομιμοποποιείται να μη περάσει κάτω απο 6725 το πολύ για να είναι ανεκτό σαν τέτοιο και μετά να ακολουθησει το ανοδικό πεντάρι στις περιοχές πάνω απο το 6770.
Πιέστε πάνω στο διάγραμμα να μεγαλώσει.

Τετάρτη, Ιανουαρίου 24, 2007

FTSE- Update Daily chart

press chart to enlarge
===========
Η ΕΤΕ δικαίωσε την επιμονή μου σε αυτήν και στο σημείο διάσπασής της στο 37.20 και πήρε πάνω της την αγορά και τον εικοσάρη σήμερα.

Το ερώτημα είναι αν ο αγοραστής έχει εντολή να συνεχίσει η να ανακόψει προς το παρόν και να επιβεβαιώσει το 37.30 , πρίν συνεχίσει την αύξηση της κεφ/σης στα...επιθυμητά επίπεδα.

Ο εικοσάρης πάντως μετά το '' χτύπημα '' στο C του 2516 προσπέρασε διαδοχικά τα εμπόδια των 2535 και 2550 και ήρθε ακριβώς στο 2571 της προηγούμενης κορυφής και σημείο κυμματικής επέκτασης , όπως το είχα δικαιολογήσει και ερμηνεύσει.

Ενδοσυνεδριακή αντίσταση στο 2579/2581.

Αυτό όμως το κατάφερε και με ενα κερί bullish engulfing όπως θα δείτε στο διάγραμμα αφ ' ενός και αφ' ετέρου με καλύτερο κλείσιμο απο εκείνο της προηγούμενης κορυφής.

Μένει να αναλάβει άλλος την συνέχεια , αν η ΕΤΕ απφασίσει να χαλαρώσει και ο εικοσάρης πλέον να διατηρήσει το 2550 κατ' αρχήν και υπερβαίνοντας το 2571 να κατευθυνθεί στους επόμενους στόχους.

ΑΤΕ- Update


Last comented here:


Η επικαιροποίηση των διαγραμμάτων αποσκοπεί σε νέα στοιχεία τεχνικά η σε καίριο timing.


Αυτό έχει γίνει αντιληπτό απο την συνέχεια και την σύνδεση με τα προηγούμενα σε διαγράμματα , που συνεχίζουν να έχουν τεχνικό ενδιαφέρον.


Έτσι και η μετοχή της ΑΤΕ θεωρώ πως βρίσκεται σε διορθωτικό κύμα 2 και σήμερα έπιασε τον πρώτο στόχο στο 4.18.


Υπάρχει μια περιοχή όπως φαίνεται και στο διάγραμμα 4.18-4.12 και 4.04 στην οποία οι επεκτάσεις του διορθωτικού αυτού σχηματισμού κρίνονται τεχνικά ανεκτές αλλά όχι και κάτω απο το 4.04 , οπου έχει τεθεί στόπ.


Άρα απο οπουδήποτε μέσα στα προαναφερθέντα σημεία και με γνώμωνα το στόπ λός μπορεί να γίνει η εκκίνηση του αναοδικού τρίτου σκέλους.


Στο διάγραμμα φαίνεται το σενάριο της ελλιοτικής ανάλυσης.


Πατήστε πάνω του για να το δείτε σε μεγάλη εικόνα.

Dax Trading Hourly Chart MoB's


Press to enlarge chart-60 minutes.

Ευρωδόλλαρο- Διάγραμμα Ημερήσιο 23-01-2007

Massive liquidation of short JPY positions is the theme of the day. USDJPY, EURJPY, GBPJPY, AUDJPY and NZDJPY are all sharply lower this morning. EURUSD and GBPUSD are also lower, but reaction is rather muted. Good support is expected around 1.2990-1.3000 in EURUSD with stops collecting below 1.2980 now. USDJPY has some bids in 120.80 area, but offers seen at 121.00-10 Το χτεσινό κερί του ευρώ διέσπασε το επίπεδο των 1.3000 και μας καθιστά αφ' ενός επιφυλακτικούς με τα σόρτ και αφ' ετέρου και τουλάχιστον στην αρχή βραχυπρόθεσμα με το μέρος των longs και με στόχο τα 1.3100 εν πρώτοις.

Παρατηρούμε ακόμα πως το χτεσινό κερί υπερκάλυψε 10 προηγούμενες συνεδριάσεις.

Σημεία εισόδου μπορεί να είναι γύρω στο 1.2970 και στόπ κάτω απο 1.2930/35.

Πατήστε πάνω στο διάγραμμα να μεγαλώσει.

Oil Shoots Higher on U.S. Announcement

By John Lee
Tuesday, Jan 23, 2007
U.S. 10-year Treasury bond prices fell today, after an $8 billion auction of 20-year inflation-protected bonds sold on high demand. Bond prices have been range-bound over the past week of trading, but today, prices pushed closer to 2-month lows. The U.S. economy has been able to produce a string of turn-around positive-growth reports, which have sent bond prices lower since the beginning of December. Prices initially shot higher last June when the Fed initiated a rate-pause to deal with a struggling housing market and slowing growth. Prices rose steadily through the second half of 2006, on continued weak reports. Since December, though, prices have been pushing lower on positive housing, manufacturing, labor and confidence reports. Bond prices tend to move lower during periods of economic strength, and higher during weakness. Investors should remain focused on key housing and manufacturing reports for more yield-related information.

The euro moved to record highs against the yen, and moved higher against the dollar, after multiple reports were released today in Europe which point to a growing economy. Consumer spending and industrial reports both pointed to accelerating growth, keeping the door open for future rate hikes. Investors speculated that the ECB would be forced to lift rates by June to deal with inflationary and growth pressures. The yen has been in major trouble lately on the global market, with Japan remaining unable to produce any sort of positive report. The U.S. is pushing back against lows on a string of positive-growth reports. The international currency market favors currencies backed by growing, inflationary economies with a need to raise interest rates, which puts the euro in the best light out of the major currencies.

Crude oil rose over 4% to close at $54.96 a barrel today, after the U.S. Department of Energy announced plans to double its strategic oil reserve over the next 2 decades. With the U.S. buying up such a large share of the global market, shares shot higher today, after already being boosted by a cold snap across the northern U.S. Cold weather usually equates to higher prices, but the U.S. announcement helped to send prices even higher today. Natural gas prices rose nearly 4% to 1-month highs, as cold weather and continued forecasts signal a spike in energy demand.
Gold futures rose nearly 2%. Gold usually moves inversely to the dollar and with oil, which is exactly what happened today. Investors sought safety in gold in the face of dollar weakness and rising energy prices. Copper prices rose 2% on signs of increased demand from the U.S. and China.

Grain prices rose across the board today. Corn rose 0.6% and soybeans rose nearly 1% on speculation that ethanol and alternative fuel demand will jump in the coming years; traders speculated that President Bush will address the issue of alternative energy resources in the State of the Union speech tonight. Wheat rose just over 3% in today's session.

Economic News
No major U.S. economic news to report today.

It Was A Very Good Year


By Vadim Pokhlebkin

2006 was good for global stocks. India, China and Russia, the three emerging global powerhouses, did especially well: India's Sensex index gained 47% last year, Russian stocks were up 67%, and China's Shanghai Composite rocketed up 130%.
And let's not forget Venezuela's IBC General index, which was up 156% in 2006, making it the best-performing stock index on the planet.
By comparison, the Dow Jones Industrial Average, the world's benchmark stock index, ended 2006 with a 16% gain.
But here's a surprising fact: German blue chip stocks, represented by the DAX index, have outperformed the global stock market average since 2003, the year when the markets bottomed. That's what Tom Denham, editor of EWI's European Short Term Update, points out in the latest, Monday (Jan. 22) issue:

============================

It's encouraging to know that one can still make money (and average better returns!) the "old-fashioned" way: by investing in more familiar markets like Western Europe rather than in exotics. (Although, I admit, dropping a line like "I invest in exotics" at a party sounds a lot cooler than "I've decided to be a little more aggressive in my 401K this year.")
Just a few years ago, if you wanted to invest in Europe or Asia, you had to: a) open an overseas brokerage account, and b) know which market to invest in. These days, exchange-traded funds and mutual funds eliminate the need to travel overseas to meet your broker.
But the need to know what market to invest in – and when to do it – remains as pressing as ever.

Don't do it this year, says Marc Faber, a famous investor and money manager, "who predicted the U.S. stock market crash in 1987" and who "advised investors to buy gold in 2001, which has since more than doubled" (Bloomberg).


Mr. Faber believes that, "In the next few months, we could get a severe correction in all asset markets." That why, "in the buying mania that we have now the wisest course of action is to liquidate." And it's precisely the stocks of last year's biggest winners – China, India and Russia – that he recommends investors be especially careful with.

Mr. Faber is not alone in his opinion, but he is in a minority: Most analysts and money managers see nothing but blue skies ahead. So what's an investor to do? Well, as usual, you have to work your way through the maze of opinions and do your own research. Technology may change how we invest, but the decision-making process is still the same, isn't it?

Τρίτη, Ιανουαρίου 23, 2007

Εβδομαδιαίο διάγραμμα Γενικού Δείκτη

Διανύουμε δεύτερη βδομάδα ταλάντωσης στον Γενικό Δείκτη και στην περιοχή 4600-4700.

Πιθανόν να βρισκόμαστε εν μέσω μιας πλευρικής ατασικής φάσης , όπως οι άλλες που έχω σημειώσει με κύκλους στο εβδομαδιαίο διάγραμμα.

Σε τυχόν διάσπαση του 4600 θα έχουμε μια όχι καλή εξέλιξη.

Στην διάσπαση του 4700 η επόμενη αναμέτρηση στο 4810-4820 και η μεγάλη στο 4934.

Διάγραμμα ΓΔ εβδομαδιαίο:
http://img259.imageshack.us/img259/1971/untitled0ty.png

COMMERCIAL BANK OF GREECE- Chart Update

Last commented here:http://dimigon-analysis.blogspot.com/2007/01/commercial-bank-of-greece-chart.html

In today's update you can observe the trial to re-enter safe area after intra break.

Daily updated Chart:
http://img105.imageshack.us/img105/3800/untitled6fc.png

VOLUME BREAK-UP-Counting-Swing

Στο διάγραμμα σήμερα μέσω της μετοχής της quest μπορούμε να παρατηρήσουμε δυό τρία βασικά τεχνικά χαρακτηριστικά και ίσως καίρια.

Εξάμηνος σχηματισμός σε rectangle διάταξη και σημεία ανάπτυξης μεταξύ 3.70 και 4.10.

Θεωρώ το σύμπλεγμα και wave rectangle με τα A-B-C και το θεωρούμενο περαιωμένο 4.

Το κερί της περασμένης Τετάρτης με το χεράκι απο κάτω έδωσε break πρώϊμο.

Την Παρασκευή είχαμε όπως βλέπετε στο διάγραμμα και στο παράθυρο των όγκων και διάσπαση όγκου του εξάμηνου σχηματισμού και ισοφάριση της διανομής των αρχών Αυγούστου.

Ακόμα καλύτερο κλείσιμο εξαμήνου με το 4.12 έστω και οριακά.

Με 1/3 του όγκου του break candle σήμερα πλαγιο-ολίσθησε.

Το στόπ πρέπει να μπεί κάτω απο το χαμηλό της Παρασκευής όπως το έχω στο διάγραμμα.

Αν πάνε όλα καλά και είναι πράγματι στο 5 ο στόχος είναι στο διάγραμμα μέσα.

Το σκεπτικό αναπτύχθηκε με σκοπό να καταδείξει την ανάγκη προσέγγισης των διαγραμμάτων με διερευνητική και αναλυτική σκέψη.

Διάγραμμα ημερήσιο:
http://img252.imageshack.us/img252/3660/untitled3up.png

Ftse-20 Athens-Σχόλιο και ημερήσιο διάγραμμα

Με το ενδοημερήσιο σήμερα σχόλιο στον εικοσάρη έδωσα την συνέχεια της χτεσινής αναφοράς του 2571.

Μάλιστα πιάσαμε ακριβώς και το χαμηλό της ημέρας του με το 2516 που ανέφερα εδώ:
http://dimigon-analysis.blogspot.com/2007/01/ftse-intraday.html

Έκανε 2516.08.
================

Απο δώ και πέρα αυτό το θεωρούμε ενα περαιωμένο κύμα απο 2571-2535-2552-2516.

Μπορούμε να το ονομάσουμε Α.

Το Β που ξεκίνησε ήδη απο κεί , έχει πρώτο στόχο στο 2552.

Τα κύμματα Β είναι δύσκολο να προβλεφθούν ακριβώς γιατί γίνονται και υπερβαίνοντα.

Μετά μάλιστα το 2550 καθαρά αν προκύψει , θα είναι και δυναμικό.

Απο το 2385 θα θυμάσθε , είμαστε long.

Αυτά τα intradays είναι προσπάθειες να επιμηκύνουν την κίνησή μας και τα οφέλη μας.

Στο σημερινό ημερήσιο διάγραμμα έχω σημειώσει τις αντιστάσεις μας και το στόχο μας μετά το 2571 , το 2510/16 που πιάσαμε σήμερα και τον ταλαντωτή που παρά τις αποκλίσεις του είναι ακόμα bull.

Διάγραμμα ημερήσιο:
http://img260.imageshack.us/img260/2366/untitled7mf.png

Ovobody

Ovobody-Overvalued, Overbought and Overbullish

Ενδιαφέροντες όροι και συσχετισμοί σε ενδιαφέρον άρθρο:

http://www.hussmanfunds.com/wmc/wmc070115.htm

FTSE-intraday σχόλιο

Κράτησε και πάλι το 2535 προς το παρόν.
commented here :http://dimigon-analysis.blogspot.com/2007/01/ftse_22.html

Και με την βοήθεια της ΕΤΕ πάνω απο τα 37.20 έγινε ενα pull back κατά πώς φαίνεται στο 2548.

Άρα έχουμε εκτός του 2535 και ενα σημείο πάνω για μπούσουλα πρίν το 2571.

Την περιοχή 2550.

Με το break 2535 θα κατευθυνθεί κατ' αρχήν στο 2516.

Currencies-a

The dollar has made a break above the long-term bearish descending triangle against the yen, rising marginally above the December 2005 high of 121 -- a bull signal for the dollar. I am wary of a false breakout and would rather wait for a pull-back to respect the new support level and confirm the up-trend. A fall below 115, on the other hand, though unlikely at this stage, would signal a test of long-term support at 100.

Currencies

The euro continues to test support at $1.29/$1.30. So long as the retracement respects the (green) upward trendline, the trend remains healthy. A fall below $1.25, though unlikely, would signal reversal.

Crude Oil

Crude oil prices continue to fall after breaking through support at $55/barrel. The next major support level is $40. Prices are in a primary down-trend.

GOLD

Spot gold is consolidating between $600 and $650. Breakout above 4650 would be a bull signal, while a fall below $600 would be bearish, signaling a test of primary support at $560. Falling crude oil prices are likely to reduce demand for gold, while a weaker dollar would increase demand; two opposing forces that may offset each other.

Equity Markets


The primary trend on the Dow Jones Industrial average is up, while a bearish divergence on Money Flow warns of a secondary correction.


The Big Picture

Further support for my theory that the Fed is able to influence (manipulate?) the stock market by raising or lowering yields on long-term bonds. A plot of the S&P 500 price-earnings ratio against 10-year treasury yields shows a clear correlation between low bond yields and high PE ratios. Many thanks to Herb, a reader, for providing the link. One of the biggest failures of the discounted cash flow model, used by many investment institutions to value future cash flows, is the use of long-term risk-free (treasury) yields instead of a stable bench-mark rate. When yields are low, valuations rise, and when yields rise, values decline. Institutional investors often fail to increase their risk premium when bond yields are low. Ten-year treasury yields are rising, having respected the 3-year trendline. Expect another test of resistance at 5.25%. The latest rise is in part a response by OPEC oil producers to the fall in the price of crude, prompting them to liquidate some of the $97 billion in treasury bonds accumulated over the last 17 months.

OPEC Dumps $10.1 Billion of Treasuries as Oil Tumbles

By Bo Nielsen and Daniel Kruger
Jan. 22 (Bloomberg) -- OPEC nations are unloading Treasuries at the fastest pace in more than three years as crude oil prices tumble, sending bond yields higher.

Exporters including Indonesia, Saudi Arabia and Venezuela, sold 9.4 percent, or $10.1 billion, of their U.S. government debt securities in the three months ended in November, according to Treasury Department data. Members of the Organization of Petroleum Exporting Countries last sold Treasuries for three straight months in June 2003.

Oil producers have surpassed Asian central banks as the largest pool of global savings, accumulating an estimated $500 billion in 2006 alone, according to research by Pacific Investment Management Co. The sales during those three months mark a reversal because OPEC countries have boosted their holdings of U.S. government bonds by 70 percent to $97 billion in the past 17 months, Treasury data show.

``There will be a significant sell-off,'' Joseph Stiglitz, a Nobel laureate and economics professor at Columbia University in New York, said in an interview. ``Medium-term and long-term yields will go up.''

Oil producers, including non-OPEC countries, have disclosed almost $200 billion of U.S. government, corporate and agency bonds, said Ramin Toloui, who helps manage about $641 billion for Newport Beach, California-based Pimco, a unit of Munich-based Allianz SE. The holdings are split about evenly between securities due in less than a year and those with longer maturities.

Higher Yields
Treasury 10-year note yields fell one basis point to 4.77 percent as of 9:05 a.m. in New York. The price of the 4 5/8 percent note due in November 2016 rose 3/32 to 98 29/32. Yields on two-year notes fell 1 basis point to 4.91 percent. Bond prices move inversely to yields.
OPEC members were selling Treasuries as crude prices declined 34 percent from a record high of $78.40 a barrel in July. They are reducing demand for U.S. government bonds at the same time as central banks from China to Romania say they want to cut holdings of dollar-denominated assets.

For every $10 drop in the price of a barrel of oil, OPEC members adjust Treasury holdings by about $34 billion, according to estimates by Michael Pond, an interest-rate strategist in New York at Barclays Capital Inc.

Yields on the benchmark 10-year note have climbed 35 basis points from a 10-month low in December as economic data on housing and employment suggested the Federal Reserve would not cut its target rate for overnight loans between banks from 5.25 percent before June.
Investing `Petrodollars'

Short-term yields have remained above those on longer-term securities since mid-August. That situation, known as an inverted yield curve, has occurred only 11 percent of the time in the past two decades, according to Bloomberg data. Traders watch that difference because four of the past five recessions have been preceded by inverted yield curves.

``The pickup in oil revenues and the recycling of the petrodollars'' was one reason for 10-year yields falling as low as 4.33 percent last year, said George Goncalves, a fixed-income strategist in New York at Bank of America Corp.

`Money to Invest'
OPEC export revenue will decline by about $42 billion by the second quarter, from a peak of $126 billion in the third quarter of 2006 as oil prices tumble, according to estimates from commodity analysts at Charlotte, North Carolina-based Bank of America. Crude for February delivery fell $1 last week to $51.99 a barrel on the New York Mercantile Exchange.

``Lower oil prices mean less inflation pressure, but that doesn't seem to be going on,'' said Stiglitz of Columbia. ``The dollar has been subjected to a great amount of exchange-rate volatility, and it's not a good store of value anymore.''

OPEC countries increased holdings of U.S. government bonds by 115 percent from 2002 to 2006 when the price per barrel rose almost tripled, according to Treasury data.
They still hold more Treasuries than in 2005, when oil prices jumped 41 percent.

``Oil prices are still high compared to the long-run average, and that leaves the oil-producing countries with money to invest in U.S. Treasuries,'' said Torsten Slok, an economist at Deutsche Bank AG in New York.
Deutsche Bank estimates Middle East countries will stop investing in U.S. securities should oil decline to $30 a barrel. Oil averaged $33.28 a barrel for the 10 years ended in 2006.

Foreign Reserves
The oil exporters in the Middle East, Asia, Africa and South America bought a monthly average of $2.5 billion of U.S. fixed- income securities in the 12 months ended in May 2005, when crude oil averaged about $42 a barrel, Goncalves said. Purchases jumped to $7.3 billion a month from June 2005 through August 2006, when oil averaged about $60 a barrel, he said.

``When you bring the oil price down, that's going to take a lot of excess money off the table,'' said Andrew Brenner, head of global fixed income for New York-based Hapoalim Securities USA, which has $70 billion under management.

Only Japan, China and the U.K. own more Treasuries than the 12-OPEC nations, according to Treasury data released last week. The OPEC data doesn't include securities owned by Russia and Norway, which account for 40 percent of oil producer reserves, according to Toloui at Pimco.
Central bankers in oil producers Venezuela, Indonesia and the United Arab Emirates have said they will invest less of their reserves in dollar assets.

China, the second-largest holder of U.S. debt, also is cutting back holdings. The central bank, which owned $346.5 billion of Treasuries as of November, trimmed purchases by 1.7 percent in the first 10 months of 2006, Treasury figures show.

``The Chinese are slowing down their buying, so that leaves a big hole after the oil money,'' said Brenner at Hapoalim Securities.

Oil Gives Up Early Gains

By John Lee
Monday, Jan 22, 2007
U.S. 10-year bond prices rose moderately today, trading within a 5-day range. Bonds moved higher on speculation that big-cap company sales of corporate bonds will boost demand for the long-term safe rate. Bonds have been trading back and forth for over a week, on conflicting reports of strength and weakness in the U.S. economy. Low energy prices and a rebounding housing market both point to U.S. strength, but more numbers are to come before the next Fed meeting in March. Bond prices usually rise on weakness and fall on strength; prices seem to be moving lower in the longer-term, but have been consolidating for the last week of trading.

The yen fell to its lowest in over 3 years against the dollar, and fell moderately against the euro. Investors speculated that recent U.S. strength will continue, and bet on a hawkish U.S. Fed outlook. The dollar has been surging against the yen since the beginning of December, when the U.S. government began to produce turn-around numbers that reflected a rebounding housing market and growing U.S. economy. The international currency market favors currencies backed by hot, inflationary economies. Japan just kept rates at 0.25% last week, as consistently negative reports continue to roll out of the country. Most of Europe has been characterized by positive growth and inflation, which has helped propel the euro higher against the dollar and the yen. The U.S. economy has just recently begun to improve its economic numbers, after a sluggish second-half of 2006.

Crude oil futures fell nearly 2% to close at $51.11, on speculation that U.S. supplies are large enough to handle any extra winter demand. Crude initially rose over 2% on cold weather fears, but last week's ample inventory report was enough to convince investors that cold winter weather will not create any huge supply pressures on U.S. reserves. Cold weather usually equates to higher prices, as more energy is needed to heat homes and businesses. Natural gas futures rose over 6% to 1-month highs today, on forecasts that cold weather will stick around in the northern U.S. through the beginning of February.

Gold futures fell 0.4%, as the dollar rose and crude prices fell. Gold usually moves inversely to the dollar and with oil, which is exactly what happened in today's session. Gold is used as a hedge against dollar weakness and rising oil prices. With the dollar at multi-year highs over the yen, investors turn away from the precious metal in favor of dollar strength. Copper prices rose 0.5% on speculation that the U.S. housing market is on the rebound, and that demand could pick up soon.

Grains traded mixed today. Both wheat and soybeans closed down fractionally for the day. Corn fell over 0.5% on favorable weather in South America, which could boost supplies.

Economic News
No major U.S. economic news to report today.

Δευτέρα, Ιανουαρίου 22, 2007

FTSE-σχόλιο

Το σημερινό υψηλό 2571 είναι ενα σημαντικό ext και ατυχώς λησμόνησα στο χτεσινό σχόλιο να το αναφέρω.
Last commented here:http://dimigon-analysis.blogspot.com/2007/01/ftse-20_21.html

Η πρώτη μεγάλη κορυφή του εικοσάρη τον Φλεβάρη 2006 στο 2367 και η μετέπειτα πρώτη μεγάλη διόρθωση το καλοκαίρι με χαμηλό 1832 διαμορφώνουν το σημερινό 2571.

Στα μεγάλα κύμματα το πρώτο σημαντικό extension είναι πάντα το 1.382 κατά fibo.

Δηλαδή η διαφορά του κύμματος που αναφέρθηκα έχει υπόλοιπο 2367-1832=535 μονάδες.

Αυτές επί το 1.382 κάνουν 535 χ 1.382 = 739

Αυτό προστιθέμενο στο χαμηλό του Ιούνη 2006 το 1832 κάνουν το σημερινό υψηλό.

1832+739=2571.

Το ίδιο θα κάνετε μετά για το 1.618 αν περάσει απο το 2571.

Απο την άλλη ήρθε πάλι και τεστάρισε το 2535 , που αναφέρω χτές και αντέδρασε απο κεί , δείχνοντας ακόμα μια φορά πως με τυχόν διάσπαση αυτού θα πάει γρήγορα για το 2490 και είναι πολύ πιθανόν.

Η ΕΤΕ έσπασε το 37.20 με το 37.60 της , που γύρεψα χτές αλλά είναι μάλλον ψεύτικο και χρήζει επιβεβαίωσης.

Ευχαριστώ,

Dimigon

GENERAL INDEX UPDATE CHART

Last commented and charted here:http://dimigon-analysis.blogspot.com/2007/01/elliott-14-01-2007.html

Elliott extension 4690 approached-
Stopping to be moved at 4630 below- ...( from 4560 before) .
Movements after 4690 to be recounted.
Nearly points 4730.

Updating to the previous diagram:
http://img262.imageshack.us/img262/6519/untitled5aq.png

Κυριακή, Ιανουαρίου 21, 2007

FTSE-20

Ο εικοσάρης μας τα ίδια.

Μια περιοχή σπάει , μια περιοχή κάνει στήριξή του και μια καινούργια επέκταση επιτυγχάνεται.

2505-2535-2558.

Έφτασε στον τελευταίο στόχο αφήνοντας τους άλλους δυό για παρακαταθήκη στήριξης η διάσπασης πτωτικής για να μας δώσει το επόμενο trade.

Δηλαδή έχει τεστάρει επιτυχώς και το 2505 αλλά και το 2535 την Παρασκευή και κάθε διάαπαση αυτών θα είναι μέσου χρονικού βεληνεκούς σήμα σόρτ.

Απο την άλλη μετά το 2558 θα προσέχουμε τα επόμενα targets , που είναι 2581 και 2599.

Η ΕΤΕ είναι ακόμα ο αδύναμος κρίκος στην κίνηση του εικοσάρη.

Άμα κάνει δυνατό κερί με κλείσιμο προς το 37.50 θα είναι προπομπός νέας ανοδικής κίνησης του εικοσάρη.

Μέχρι τότε και όσο αποκρούεται απο το 37.00-37.20 θέλει προσοχή μη παρασύρει κάποια στιγμή και τον δείκτη και τις άλλες μετοχές δίκην ντόμινο.

Καλή βδομάδα.

euro-Us Dollar--

Για το ευρωδολλάριο τα έχουμε πεί και το ζευγάρι της ισοτιμίας δεν μας απογοητεύει απο τις προβλέψεις μας.

Την Παρασκευή κατάφερε να φτάσει το 1.3000 σημείο , που απο καιρό έχω αναφέρει απο την περιοχή 1.2860 και να αποκρουστεί απο αυτό απότομα καθιστώντας το νευραλγικό για την συνέχεια.

Θα το δούμε και πάλι απλά.

Αν περάσει το 1.3000 θα πάει 1.3100.

Όσο αποκρούεται και μόλις σπάσει και το 1.2920/1.2900 , θα καταλήξει γρήγορα στο 1.2770.

Καλά trades.

Forth wave breaks-Sample AVE equity

A forth degree wave is permitted to break 0-2 line once and some times twice.

In the sample of AVE we can observe this elliott parameter in evolution at the right time now.

She can obviously make a false break till 4.66/70 or not but not below.

And then to proceed upwards to fifth wave counting first target at the top and second 7.20.

In the chart specific remarks have been plotted.

Diagram:
http://img267.imageshack.us/img267/3719/untitled4xm.png

Παρασκευή, Ιανουαρίου 19, 2007

ΕΔΡΙΠ- Elliot wave analysis for study reasons-Update

Last commented and charted here : http://dimigon-analysis.blogspot.com/2007/01/elliot-wave-analysis-for-study-reasons.html
============
Updating Study Chart.
Just updating. ( for comparison's reasons).
She walks by the book till now.

Diagram updating:
http://img201.imageshack.us/img201/3695/untitledij8.png

Oil Continues to Fall- Thursday, Jan 18, 2007

By John Lee
------------

U.S. 10-year bonds closed higher today, bouncing back after yesterday's slide. Bond prices have been pushing lower since early December, on a string of positive economic reports from the U.S. Bond prices fall on strength and growth, and rise on weakness. Bonds initially shot higher last June, when the Fed initiated a rate-pause on overall economic weakness and slowing growth. The momentum seemed to shift in early December, when the U.S. posted positive housing and confidence numbers, a contrast to the bleak outlooks from the second half of 2006. The housing market remains a major concern for investors and speculators, and will be closely watched as a broad economic indicator for the health of the U.S. economy.

The yen fell to nearly 4-year lows against the dollar, and pushed closer to its record lows against the euro today. The BoJ today held its benchmark rate at 0.25% today, ushering in a wave of yen selling against the dollar and euro. The yen has been under fire lately, as Japan continues to be unable to produce any consistent positive reports of growth and inflation. The international currency market favors currencies backed by hot, inflationary growth. Europe has had no trouble in producing these types of numbers, propelling the euro to recent record highs against both the dollar and the yen. The dollar moved dramatically higher against the euro off of near-lows at the beginning of the year, but appears to be consolidating at the moment.

Crude oil closed down 3.3% at $50.50 today, after an Energy Department report showed that crude oil supplies grew last week. Crude oil is now down 36% from record highs from over the summer, and OPEC has been calling for more and more output reductions to keep prices up. Despite a current withholding of nearly 2 million barrels a day, warm weather and ample supplies continue to drive the price of crude lower. Natural gas rose 1.5%, as forecasts call for cold weather to continue throughout the month. Weather plays a crucial role in most energy prices, but especially natural gas, which is used to heat homes.

Gold prices fell nearly 1%, as investors sold the metal with falling oil prices. Gold usually trades inversely to the dollar and with oil, and it was oil action that dominated today's gold trading. Traders turn to gold as a hedge against rising oil prices, and with oil falling steadily, gold is losing its luster. Recent strength in the dollar has also helped to send gold lower. Copper prices fell 3%, as large supplies continue to dampen any worries.

Grain prices traded mixed today. Corn rose fractionally, pushing towards 10-year highs. Soybeans fell nearly 1%, and wheat fell just over 1%.

Economic News
U.S. consumer prices rose 0.5% last month.

Housing starts unexpectedly rose in December.

COMMERCIAL BANK OF GREECE- Chart

Some people developed interesting of viewing the current technical situation of the specific quote.

Here is a chart of her showing waving and charting conditions up today.

Diagram:

http://img255.imageshack.us/img255/8778/untitlednz6.png

Πέμπτη, Ιανουαρίου 18, 2007

Ευρωδόλλαρο Hourly chart

Last commented here: http://dimigon-analysis.blogspot.com/2007/01/17-01-2007.html

Ξανά αυτή την ώρα προσπαθεί να σπάσει αντιστάσεις και να περάσει και το 1.3000.

Τρίτη φορά.

Ο σχηματισμός είναι κατά πάσα πιθανότητα συνέχισης της προηγούμενης τάσης.

Αλλά σε περιπτώσεις σαν και αυτές είναι καλύτερα να τον αφήνουμε να μας το δείξει.

Στο σημερινό-αποψινό ωριαίο διάγραμμα φαίνονται τα σημεία , που θα οριοθετήσουν διασπάσεις και κατευθύνσεις ( 1.3000-1.3030) - 1.2890 ) και σε περίπτωση ανοδικής λύσης και ο στόχος στο 1.3130.

Διάγραμμα:
http://img249.imageshack.us/img249/1719/untitledtq4.png

Ftse-20 Σχόλιο

Λοιπόν σε αυτό το σχόλιο : http://dimigon-analysis.blogspot.com/2007/01/ftse-20_16.html

Είχα ζητήσει περιφρούρηση της περιοχής 2500-2513 κατ ' αρχήν για να έχει το κερί της 15-01-07 ισχύ σαν ανοδικό.

Η περιοχή κράτησε καλά σε αρκετά ωριαία τέστς και δυό ημερήσια.

Σήμερα διασπάστηκε και το 2535.

Και πιάσαμε λίγο πρίν το 2558 (2555) , που αναφέρω στο σχόλιο σαν πρώτη επέκταση.

Έχουμε λοιπόν τώρα το 2580 και 2595/99 σαν επόμενους στόχους.

Επειδή πιάσαμε με το 2558 μια ελλιοτική επέκταση είναι θεμιτό να έχουμε μια διόρθωση μερικών ωρών.

Δεν πρέπει βέβαια τώρα να πάμε κάτω απο το 2500 σαν μακρινό θα έλεγα στόπ αλλά και για τα πιο κοντινά trades θα πρέπει να κρατήσει η περιοχή 2530/35.

Happy trading and good hunting.

FTSES-80 ( Ογδοντάρης) Update Σχόλιο

Last commented here : http://dimigon-analysis.blogspot.com/2007/01/ftses-80_14.html

Αφού λοιπόν όπως ζήτησα στο σχόλιο πέρασε το 890 ( και πρίν μας είχε ακούσει το 60 μας) , αμέσως μετά και δυό και τρείς φορές το τεστάρισε και το κατοχύρωσε .

Άρα πρώτο στόπ and selling για ενα ικανό ποσοστό των μικρών μετοχών πρέπει να είναι ενδεχόμενη διάσπαση του 890 προς τα κάτω.

. & _

Light Crude Oil - Continuous Contract


Commentary:The recent weakness in oil prices has brought about many questions of when with the declines will come to an end. As you can see from the chart above, oil prices have moved sharply lower since the highs made in mid 2006, and i think that this downward momentum will continue. The long-term trendline, which i 've drawn on the chart, will be used by many traders to suggest that the bears may not rest until they push the price down toward the support near $45

Bonds Fall on PPI, Housing Data

Bonds Fall on PPI, Housing Data
By John Lee
Wednesday, Jan 17, 2007


U.S. 10-year Treasury bond prices fell today, after two reports pointed to inflationary pressures. A government report showed that wholesale prices (PPI) rose more than analysts expected in December, and another report showed that homebuilder confidence grew this month. Bond prices have been pushing lower since the first of December, on growing signs that the U.S. economy is turning around after a period of slow growth and ugly numbers.

The housing sector remains a key focus for investors and speculators, who will want to see consistent strength in all areas of the housing market for bond prices to continue to fall. Interest rate futures show a nearly 100% chance that the Fed will continue to hold the overnight rate at 5.25% in March, whereas last year many investors were speculating that the Fed would need to cut rates by that time. Watch for key housing, manufacturing and confidence reports in the future to affect this solid move lower by bond prices.

Despite two positive reports from the U.S., the dollar fell against the euro today after a government report showed that investors bought the most foreign stock in November since at least 1977. An increase in foreign security investments exacerbated concerns that the dollar is being discarded in favor of the euro. More and more countries are increasing their currency reserves to favor the euro over the dollar, which has helped to propel the dollar lower. The international currency market favors currencies backed by hot, inflationary economies, which places the euro in a favorable light. The countries that comprise the EU have been able to consistently produce hot, growth-oriented numbers, while the U.S. has only recently been able to rebound from a sluggish second half of 2006. The yen is performing poorly, as Japan has no real need to lift rates to deal with growth and inflation; the BoJ is expected to hold rates later this week. The dollar gained fractionally against the yen today.

Crude oil futures rose nearly 2% today to close at $52.18, as cold weather settled across the U.S. Crude oil has been falling dramatically into 2007, losing well over 10%. OPEC has threatened for output cuts in addition to the nearly 2 million barrels a day that are currently being withheld. However, OPEC's threats seem to have little to no effect on the price of oil, due in part to an inability of its members to make a united stand. Cold weather should prop up energy prices, though, as cold weather equates to more energy demand to heat homes, and higher prices. Natural gas fell over 6% today, as investors speculated that inventories could easily meet any increase in demand stemming from cold weather.

Gold rose over 1% to a two-week high today, as investors sought refuge from a falling dollar. Gold futures usually move inversely to the dollar and with oil, which is exactly what happened today. Gold is used as a safe-haven against dollar weakness and high energy prices, but dollar action seemed to guide gold trading today. Copper prices fell fractionally today, as high inventories continue to ease demand pressures.

Grains gained across the board, after sliding yesterday. Corn rose just over 1%, soybeans rose nearly 2% and wheat rose around 2.3%. Orange juice futures rose nearly 3% on supply fears stemming from a cold snap in California.

Economic News
The PPI grew 0.9% in December, compared with most analysts expectations of 0.5%.
Homebuilder confidence rose to a 6-month high in January.
John Lee

Τετάρτη, Ιανουαρίου 17, 2007

Ftse-20 update chart

Καμμιά αλλαγή.

Last commented here : http://dimigon-analysis.blogspot.com/2007/01/ftse-20_5393.html

update chart:
http://img443.imageshack.us/img443/6600/untitledwq7.png

National Bank of Greece - Counting

A probable wave analysis scenario for the share , developed for near period term.

Chart below:
http://img155.imageshack.us/img155/4070/untitledwn0.png

ATE- Update counting 17-01-07

Last commented here : http://dimigon-analysis.blogspot.com/2007/01/ate-update-counting-12-01-07.html

Ακριβώς εκεί που ήταν σημειωμένο σαν R και στο 38.2% απο τα ψηλά και στην εκπλήρωση της πεντακυμματικής ακολουθίας , που είχα στο διάγραμμα πλοττάρει σαν πρώτο κύμα , η μετοχή χτύπησε και ξεκίνησε το διορθωτικό της Β σε κάποιο απο τα retrc's και ιδανικά στο 4.10-16...

Με το σημερινό ίδιο επικαιροποιημένο διάγραμμα καθίσταται σαφές και με σύγκριση με το προηγούμενο , το τι κάνει η αξία.

Διάγραμμα update:
http://img402.imageshack.us/img402/9522/untitledfo4.png

Ευρωδόλλαρο- Διάγραμμα Ημερήσιο 17-01-2007

Last commented here : http://dimigon-analysis.blogspot.com/2007/01/12-01-2007.html

αντίδραση by the book απο περιοχή 1.2860...

με το που αντίκρυσε το 1.3000 ( 1.2990)...ανέκρουσε πάραυτα πρύμνα.

Είναι το σημείο κλειδί 1.3000-1.3020 για να έχει ελπίδες μια νέα του κίνηση σαν a-b-c ενός ανοδικού Χ .

συγκρίνοντας τα δυό διαγράμματα το πρίν και το μετά βλέπουμε γιατί χτύπησε στο 1.2990 και πως η περιοχή μεταξύ 1.2800-1.2850 είναι γεμάτη στηρίξεις και έλλιοτ retrc's.

Αν δεν κρατήσει νέα πτωτική συνέχεια αναμένεται.

Διάγραμμα update:
http://img300.imageshack.us/img300/1315/untitledvi8.png

DAX update

Στα δυό διαγράμματα Dax Daily φαίνεται πως η περιοχή του 6750 κράτησε τον δείκτη και το 6705 στήριξε προς το παρόν.

Οι ζώνες είναι tradable.


Last chart here : http://img181.imageshack.us/img181/8959/untitledmb1.png

Same update : http://img294.imageshack.us/img294/7487/untitledjb7.png

Τρίτη, Ιανουαρίου 16, 2007

FTSE-20 Σχόλιο και ημερήσιο διάγραμμα.

Last commented here : http://dimigon-analysis.blogspot.com/2007/01/ftse-20_16.html
=======================

Ο '' λογαριασμός '' του κύμματος και το γινόμενο με το 2539 απο τη μιά και το 37.00 της ΕΤΕ απο την άλλη έχουν φρενάρει στο 2538 τον εικοσάρη.

Η ALPHA βοηθάει κρατώντας το 24.70 και στοχεύοντας το 27.10/20 αλλά η ΕΤΕ δεν συνδράμει και δεν θα είναι αρωγός όσο κρατιέται κάτω απο το 37.00.

Πρέπει να κινηθούν άλλες παράπλευρες αξίες του εικοσάρη αλλιώς η διόρθωση κάτω απο το 2538 θα συνεχιστεί για χαμηλότερα πρός το gap και τα άλλα retrc's , πρίν ο δείκτης τροχιοδρομήσει νέα πορεία προς τους επόμενους στόχους μέχρι το 2594.50.

Στο σημερινό διάγραμμα φαίνεται η μέτρηση απο 1910-2404 και το 2594.50 που προκύπτει απο αυτήν.

Μέχρι τώρα πρέπει να έχει γίνει το πρώτο μέρος του κύματος 5 και με την διόρθωση σε εξέλιξη να γίνεται το δεύτερο.

Όλο αυτό το σενάριο θα είναι σε ισχύ , όσο η διόρθωση δεν κατέλθει απο το 62% αυτού του κύμματος στο 2385 , που είναι και το ισχυρότερο οχυρό όπως θα θυμάσθε απο την διάσπασή του και τώρα συμβαίνει να είναι και retrc.

Αυτά είναι πλήρως αποτυπωμένα στο σημερινό ημερήσιο διάγραμμα.

Διάγραμμα:
http://img46.imageshack.us/img46/1848/untitledxo5.png

Equity Markets

There is no indication as yet that the current bearish divergence on Twiggs Money Flow warns of anything more than a secondary correction for the Dow Industrial Average, but we need to remain vigilant.

The Big Picture

One of the biggest failures of the discounted cash flow model, used by many investment institutions to value future cash flows, is the use of long-term risk-free (treasury) yields instead of a stable bench-mark rate. When yields are low, valuations are higher, and when yields rise, values decline. Rising long-term yields can have a profound impact on equity markets. Ten-year treasury yields remain in an up-trend, having respected the 3-year trendline. Expect another test of resistance at 5.25%.


The yield differential (10-year minus 13-week treasury yields) remains negative, warning of long-term pressure on banking margins and a possible down-turn

Crude Oil

Crude broke through support at $55/barrel, signaling a long-term down-trend. The next major support level is $40. Recovery to above $55 appears less likely, but would indicate a weak down-trend and possible bear trap.

USD/JPY

The dollar is in a long-term bearish descending triangle against the yen, with support at 100. A breakout above the December 2005 high of 121, however, would be a strong bull signal for the dollar. Failure to breakout would most likely form a bullish ascending triangle between the (green) upward trendline and resistance at 121. A fall below 115 is less likely at this stage, but would signal a test of long-term support at 100.

Currencies

The euro penetrated support at $1.30, indicating a slower trend. If the retracement respects the (green) upward trendline, the up-trend will be considered healthy. A fall below $1.25, though less likely, would signal reversal.

GOLD

Spot gold is in a large triangular consolidation which started with the high of May 2006. The metal has so far respected support at the mid-point of $600. A fall below this level would signal a test of primary support at $560. Breakout above $650, on the other hand, would signal resumption of the primary up-trend. Crude oil prices below $55 are likely to reduce demand for gold, while a weaker dollar would increase demand; two opposing forces that may offset each other.

Σύντομο σχόλιο για FTSE-20

Υψηλό 2538 - Χαμηλό 2513 σήμερα ( χτές) 15-01-2007.

Είχα δώσει 2540 για στόχο ημέρας .

Το 2513-2500 το κρατάμε πια στο χέρι σαν σημαντικό σημείο για την κοντινή μας συνέχεια.

Διάσπασή του θα σημάνει αναβολή της τάσης.

Το σημερινό κερί δείχνει συνέχεια της τάσης με την πάνω προϋπόθεση διακράτησης των 2500-2513.

Και αυτό γιατί το 2540 είναι μια σημαντική επέκταση κατά έλλιοτ σαν πέντε ( 2357-2513)=156 χ 62% =97 , 2442+97=2539.

Μετά το 2540 θα έχουμε περιοχή 2570-2580 και μια επέκταση λίγο πρίν στο 2558.

Η ΕΤΕ μια ανάσα απο την διάσπαση και αν τα καταφέρει αύριο , θα δώσει και στον δείκτη την απαιτούμενη ορμή για την επίτευξη των επόμενων στόχων και για την διατήρηση των κεκτημένων 2500-2513 , τα οποία οφείλει να διατηρήσει για μια καλή συνέχεια.

Κυριακή, Ιανουαρίου 14, 2007

ALPHA Update

Με την τραπεζομανία της Παρασκευής άνοιξε και πέρασε με γκάπ την αντίσταση και στόχο των 24.70.

Προς το τέλος και υπο την πίεση ρευστοποιήσεων πλησίασε την περιοχή του 25.00.

Πρέπει τώρα να κρατήσει την neck-line 1-1-1 , που θα δείτε στο διάγραμμα και το 24.70.

Καλό θα είναι να μην κλείσει και το γκάπ γιατί θα θεωρηθεί εξάντλησης , ενώ αν δεν το κλείσει εκκίνησης μετά απο διάσπαση.

Ο πρώτος στόχος με τις προϋποθέσεις που αναφέρθηκαν είναι 27.20.

( Η ΕΤΕ και πάλι δεν τα κατάφερε στα 37.00- next time ..).. αν προκύψει...

Διάγραμμα:
http://img108.imageshack.us/img108/6104/untitledrl7.png

ΓΕΝΙΚΟΣ ΔΕΙΚΤΗΣ απλό αλλά καλό.

Επειδή τις πιο πολλές φορές μια απλή λύση είναι αυτή που δίνει μια λύση...:)

Και όσο πιο απλή τόσο πιο δύσκολα είναι ορατή.

Έχω δεί σε διάφορα διαγράμματα απλών γραμμών τάσης η ένωσης κορυφών μια γραμμή.

Και θεωρείται πλέον διασπασμένη η σε επαφή.

Μια γραμμή σε linear chart δυό κορυφών δεν έχω δεί.

Και είναι τόσο απλή και την παρουσιάζω στο διάγραμμα απο κάτω.

Αύριο την βρίσκει στο 4666 η όπου την βρεί.

Αν την βρεί , αν αποκρουστεί κ.λ.π...

Απλά είναι στα ...απλά που πρέπει να έχουμε υπ ' όψιν.

Διάγραμμα ΓΔ με απλή linear :
http://img406.imageshack.us/img406/7854/untitledek9.png

ΕΔΡΙΠ- Elliot wave analysis for study reasons

Μέσα σε αυτό το διάγραμμα μπορείτε να μελετήσετε για όσους ενδιαφέρει βέβαια μια ανάπτυξη κυμματική σε μικρό συνδυασμό με διαγραμματικη μέθοδο.

Και λέω να μελετήσετε γιατί αυτός είναι και ο βασικός σκοπός του blog.

Το κέντρισμα προς απόκτηση περισσότερης τεχνικής κατάρτισης και όχι τα λαυράκια των σομόν φυλλάδων στο πιάτο.

Αυτά κάνουν φτερά και γίνονται πουλάκια.

Ενώ αυτά που θα μείνουν στο κεφάλι μας , θα είναι για πάντα δικά μας ( εν ζωή)_..:-)

Διάγραμμα ελλιοτικής ανάπτυξης με παράδειγμα μια μετοχή ( εδρίπ).
http://img129.imageshack.us/img129/871/untitledgg2.png

DOL SAMPLE AS A WAVE SCENARIO

Δεν ασχολήθηκα ξανά με την μετοχή γιατί ακόμα δεν έχουν εκπληρωθεί οι προϋποθέσεις για να γίνει .

Δεν μπορώ να γνωρίζω τους λόγους , που υστερεί έναντι της αγοράς ενώ ανέκαθεν υπήρξε σηματωρός και πρωτοπόρος.

Κυμματικά δείχνει ακόμα να έχει ενα κύμα πέντε κάτω.

Σε περίπτωση λάθους υπάρχει στο διάγραμμα και η περιοχή MoB καθώς και η βασική elliott-line 2-4 διάσπαση των οποίων θα σημάνει και τέλος του κύμματος 5.

ελλιοτικό διάγραμμα:
http://img187.imageshack.us/img187/1664/untitledbs3.png

FTSES-80 Σχόλιο......

Κατά γράμμα...( by the book ) ο μικρός.

Links : http://dimigon-analysis.blogspot.com/2007/01/ftses-80-update.html

Αν περάσει και το 890-892 θα δείξει πως στο 861 με πολλές πιθανότητες περαίωσε μια διόρθωση.

Αν όχι θα είναι αυτό απο το 861-890/92 το δεύτερο μέρος της διόρθωσης σαν b και θα ακουθήσει το c με 45 μονάδες κάτω.

ΣΙΔΕΝΟΡ Educational update-14-01-2007

Στο λίνκ αυτό αφήσαμε τον τελευταίο σχολιασμό για την μετοχή.
Παραθέτω σήμερα την συνέχεια του δεύτερου μέσα σε αυτό το λίνκ διαγράμματος , αυτό που αναφέρεται στην ελλιοτική άποψη.
Είναι κατά πάσα πιθανότητα στην διαμόρφωση του τέταρτου κύμματος σε ενα απο τα παρατιθέμενα στο επικαιροπoιημένο διάγραμμα retrc's με σκοπό να ακολουθήσει το πέμπτο ανοδικό κύμα.

Link: http://dimigon-analysis.blogspot.com/2006/12/educational-update-24-12-2006.html

Update
http://img443.imageshack.us/img443/9788/untitledkl9.png

Principle of a corrective wave:
=====================

Likewise, a small shock
indicates weakness in the subsequent move, as market participants take profits or add positions with the
original trend, implying that the primary trend is still intact and a minor correction has occurred. Picture
a shock as producing successive waves in a pool of water following the impact of a rock. A small rock
dissipates little energy therefore; the subsequent waves (price movement) are smaller and somewhat
transitory in their progression. A large rock on the other hand, disperses a lot of energy, as such; the
waves will be larger and more noticeable as they progress outward. In short, the larger the rock (crowd
consensus) the bigger the reaction. Hence the further energy (wave) will travel.

DAX Update Σχόλιο

http://dimigon-analysis.blogspot.com/2007/01/dax-11-01-2007.html

Στο λίνκ απο πάνω είχα ζητήσει διάσπαση μιας απο τις δυό περιοχές , που αναφέρονται και trade στις προσεγίσεις τους.

Την επόμενη του σχολίου μέρα ο Dax πρωί-πρωί προσέγγισε ακριβώς την πάνω περιοχή με το 6622 και αποκρούστηκε βίαια σε απόσταση 60 πόντων.

Αμέσως μετά τις απογευματινές ώρες και με την δεύτερη προσπάθεια η περιοχή διασπάστηκε.

Οφείλαμε να κάνουμε το αναφερόμενο στο σχόλιο του link '' trend following ''.

Ανέπτυξε μετά απο αυτή τη διάσπαση προωθητικό κύμα και είναι καθ ' οδόν για την περιοχή 6730-6740 , όπου οι κινήσεις θα επαναπροσδιοριστούν.

Στο σημερινό ημερήσιο διάγραμμα εμφανίζεται μια περιοχή εύρους 200 μονάδων.
Εντός αυτής σημεία απο μετρήσεις και μελλοντικά σαν στόχοι και του παρελθόντος σαν στηρίξεις προς επίτευξη των στόχων.
Βραχείας για τον συγκεκριμένο δείκτη προοπτικής και μπορούν να γίνουν trading με πολύ μικρά στόπς σε προσεγγίσεις αντιθετικές η διασπαστικές.

Διάγραμμα:
http://img181.imageshack.us/img181/8959/untitledmb1.png

FTSE-20 σχόλιο

http://dimigon-analysis.blogspot.com/2007/01/ftse-20-update-10-01-2007.html
Στο λίνκ απο πάνω έχει γραφεί πως αν περάσει το 2513 , έχει μετά το 2530.
Ο Δείκτης είναι tradable product και έτσι πρέπει να αντιμετωπίζεται.
Έκανε υψηλό 2528 και γύρισε και μέχρι 2505.
===================================

Το ημερήσιο κερί είναι ενα doji star με διορθωτικά επακόλουθα αλλά χρήζει επιβεβαίωσης απο το επόμενο κερί.
Let's wait then.
=======

Κάτω απο 2500 η εικόνα χαλάει και το αστέρι θα μείνει στον αέρα.

Πάνω έχει το γνωστό 2530 και μια περιοχή 2530-2540.

Ελλιοττικά αρμονικά 2570.

Happy trading.

ΓΕΝΙΚΟΣ ΔΕΙΚΤΗΣ Elliott 14-01-2007

Δεν ασχολούμαι με τον Γενικό Δείκτη απο τα μέσα καλοκαιριού 2006 και μετά.

Θεωρώ πως ήταν η κίνησή του αδιάφορη και μάλλον μη συσχετιζόμενη με τις κινήσεις των επι μέρους μετοχών κάθε μιά απο τις οποίες δρομολογούσε δική της ρότα.

Περισσότερο ασχολούμαι με τον εικοσάρη αφού αφορά μεγάλο μέρος των συμμετεχόντων στην αγορά σαν δείκτης με σχετικά καλό αναλογικά volatility και πληρωτέο επι τη ...εμφανίσει στην αγορά των παραγώγων.

Υπάρχουν όμως σχετικά καίριες κυμματικά περίοδοι και σε ό,τι αφορά τον Γενικό Δείκτη και είναι δυνατόν αν αποδειχτούν και έτσι , να επηρεάσουν κατά το μάλλον και τις κινήσεις του μεγαλύτερου μέρους των μετοχών.

Μια τέτοια περιοδος ελλιοτικά είναι στο κοντινό μας προσκήνιο και οφείλουμε να την παρακολουθήσουμε τεχνικά , αφού απέχει μερικές μόνο μονάδες απο το κλείσιμο της Παρασκευής στον Γενικό Δείκτη.

Στο διάγραμμα που ποστάρω σήμερα είναι μια προσπάθεια απεικόνισης της προηγηθείσας απο το 3362 κίνησης και το τι μπορούμε να περιμένουμε στο κοντινό μας κατ' αρχήν μέλλον.

Διάγραμμα Γενικού Δείκτη:
http://img243.imageshack.us/img243/3074/untitledbx0.png

Σάββατο, Ιανουαρίου 13, 2007

ATE- Update counting 12-01-07

Η ΑΤΕ πάει μέχρι τώρα ...by the book που λέμε στην ΤΑ.

Το διάγραμμά της με την υφιστάμενη μέτρηση σε εξέλιξη :
http://img178.imageshack.us/img178/7875/untitledsz7.png

Ευρωδόλλαρο- Διάγραμμα Ημερήσιο 12-01-2007

Commented and here : http://dimigon-analysis.blogspot.com/2007/01/03-01-2007.html

Έχει φτάσει στην περιοχή απο την διάσπαση της οποίας δημιούργησε το τελευταίο ανοδικό του κύμα στο 1.3360.

Είναι αυτή του 1.2850 σύν πλήν.

Μια αντίδραση απο δώ προς το 1.3000 μπορεί να γίνει και μέσω της ποιότητάς της θα κριθεί και η περαιτέρω του πορεία.

Αλλά μόνο αν περάσει το 1.30 θα έχει πιθανότητες να αποδείξει πως του λείπει ενα κομμάτι ανόδου ακόμα κυμματικά σαν 5.

Κάτω απο το 62% που θα δείτε στο διάγραμμα , την γραμμή λαιμού και την ζώνη υποστήριξης του κεριού της 22-11-2006 η επωδός sell the rallies , που μας έδωσε πάμπολλα τίκς απο το 1.3300 θα επανέλθει.

Study the Chart pls:
http://img145.imageshack.us/img145/2094/untitledcu0.png

Πέμπτη, Ιανουαρίου 11, 2007

FTSES-80 ( Ογδοντάρης) update

Last commented here : http://dimigon-analysis.blogspot.com/2007/01/ftses-80.html

========

Απόλυτος σεβασμός στην περιοχή μας με χαμηλό 861.30 και κλείσιμο 866.18.

Προσοχή λοιπόν σε όσα αναφέρθηκαν για αυτήν.

Για να γίνει καλύτερος και αυτός και οι μετοχές του

εκτός της διατήρησης της περιοχής μας ,

καλό θα ήτανε να περάσει κατ ' αρχήν και το 877.

Keep it simple...

Ftse-20 Update-11-01-2007- ΕΤΕ - ALPHA

Ο εικοσάρης επιβεβαίωσε με το σημερινό του άνοιγμα , όσα χτές αναφέρθηκαν στο τεχνικό του σχόλιο.

Δηλαδή διορθωτική κίνηση κατ' αρχάς απο την περιοχή των 2500 μονάδων και ενίσχυση της παρατήρησης μέσα στο χτεσινό του σχόλιο , που αφορούσε την ποιότητα του κεριού του προχτεσινού πλέον μετά ανοίγματος.

Ακόμα μας έδωσε και άνοιγμα ακριβώς κάτω απο 2490 και κατευθύνθηκε τάχιστα στην περιοχή 2450.

Νέο στοιχείο υπάρχει.

Είναι ενα κερί φιλικά σύμμαχο προς εκείνο της χτεσινής αναφοράς και έχει μήκος εκτεινόμενο απο υψηλό 2474 έως χαμηλό 2458.

Σχηματίστηκε χρονικά ακριβώς την ίδια ώρα με το αναφερθέν στο χτεσινό σχόλιο δηλαδή στις 11.00 και μάλιστα με τον ίδιο όγκο.

Ενδείξεις πως είναι οι ίδιοι πωλητές η ... ομοιδεάτες καθυστερημένοι .

Λάβετε υπ ' όψιν και παραλληλείστε τις κινήσεις σας και με την κατανίκηση η όχι και αυτού του μαύρου στρατιώτη , όπως ανέφερα και για τον χτεσινό.

Απο την άλλη διάσπαση του σημερινού χαμηλού θα ανοίξει την διόρθωση προς την σημαντική περιοχή των 2400.

Και μια σύντομη αναφορά στις μετοχές βαρόμετρα , που παρακολούθησα τελευταία.

Η Πίστεως είχε δοθεί με στόχο 24.70 και έκανε τρείς φορές 24.74 !
Η Εθνική είχε δοθεί με εμπόδιο το 37.00 και δεν το κατάφερε και ο Οτέ σκόνταψε πλησίον στην διπλή κορυφή , όπως είχα αναφέρει για όλα αυτά στο σχόλιο για τα λήγοντα εις ΤΕ.

( Μια υπεραπλουστευμένη αλλά χρήσιμη ένδειξη για επαναφορά της αγοράς σε ανοδικό momentun θα είναι η διάσπαση αυτών των σημείων των μετοχών σηματωρών , που προανέφερα- Το 37.00 για την εθνική-Το 24.74 για την πίστεως και το 24.50 για τον οτέ).

Είναι οπωσδήποτε αρκετά νωρίς για παρόμοιες εκτιμήσεις αλλά απο την στιγμή , που η Εθνική δεν τα κατάφερε στο 37.00 το σενάριο της μεγάλης της διόρθωσης ( και ό,τι αυτό συνεπάγεται για την αγορά ) επανέρχεται.

Και θα είναι σε ισχύ όσο μένει κάτω απο το 37.00 και όσο φτιάχνει κεριά εκκίνησης bearish σαν το σημερινό.

Με αυτές τις παραμέτρους τηρούμενες βάζει παρακαταθήκες για χαμηλούς στόχους.

Δεν τους αναφέρω ακόμα αλλά είναι αρκετά χαμηλοί.

Είναι στο χέρι της ( στο 37 της μάλλον :-) ) να αποδείξει το αντίθετο.


Προσθέτω ενα απλό και καθαρό διάγραμμα του Ftse-20 σε ημερήσιο time frame , το οποίο θεωρώ πως θα βοηθήσει αρκετά τις κινήσεις σας.

http://img187.imageshack.us/img187/6595/untitledsr0.png


Καλές αποφάσεις.

Αν έχετε κάτι να παρατηρήσετε η να ζητήσετε για διευκρίνηση η ανταλλαγή απόψεων σε τεχνικά μας θέματα και απορίες , μπορείτε να αφήσετε comment η e-mail , που δίνει το blog την δυνατότητα.

Thnx

Dax-11-01-2007


προσπάθεια να συρρικνωθούν οι απώλειες με την βοήθεια των Αμερικάνικων δεικτών.

τα τεχνικά στοιχεία δεν έχουν γυρίσει υπέρ της συνέχισης του ανοδικού του τέμπου ακόμα.

αυτά βεβαίως που αφορούν την βραχεία του εικόνα γιατί η μεσοπρόθεσμη είναι ακόμα αλώβητη και bull.

στην βραχεία του εικόνα και μετά την χτεσινή εκτίμηση περί της έναρξης μιας διορθωτικής κίνησης ο Γερμανικός δείκτης ξεκίνησε με πτωτικό χάσμα και εξ...ανατολάς επηρεασμένος.

στην περιοχή 6525 μέχρι 6500 εμφανίζονται και στηρίξεις αλλά και περιοχή πολικότητας αφού είναι αυτή , που έδωσε την διάσπαση στις 13-12-2006 και το ρετέστ στις 22-12-2006.

για να επανακτήσει ο δείκτης όμως το ανοδικό του βήμα προς τον εκκρεμή στόχο των 6730 χρειάζεται μια απλή διάσπαση .

αυτή της περιοχής 6615-6625.

συμπερασματικά για swing trades επωφελούμεθα των προσεγγίσεων των περιοχών που αναφέρθηκαν 6500-6525 και 6615-6625 ,είτε για κινήσεις αντιθετικές σε κάθε προσέγγιση με μικρά στόπς , είτε για ακολουθία τάσης σε τυχόν διάσπασή τους και πλέον position trading.

Τετάρτη, Ιανουαρίου 10, 2007

Ftse-20 Update-10-01-2007

http://dimigon-analysis.blogspot.com/2007/01/ftse.html

Ο εικοσάρης απο το λίνκ πάνω και λίγο πιο πρίν , είχε δοθεί απο την περιοχή 2375-2385 με στόχο 2500.

Ο Στόχος έχει πιαστεί.

Νεότερα στοιχεία για την επερχόμενη διόρθωση μέσω κυμματικής η σχηματικής ανάλυσης δεν έχουν δημιουργηθεί ακόμα εκτός του επιτευχθέντος στόχου.

Μια κατ' αρχήν ένδειξη θα είναι μια αυριανή αδυναμία να κλείσει ενα ωριαίο κερί καθαρά πάνω απο το 2502-2507.

Και αυτή η ένδειξη προκύπτει απο μια άλλη παρατήρηση.

Είναι το hourly candle των ρευστοποιήσεων αμέσως μετά το άνοιγμα και το οποίο δεν νικήθηκε τις επόμενες ώρες.

Και αυτό είναι μια καλή ένδειξη....:-)

Αυτό έχει μήκος απο 2513 μέχρι 2494.

Αν συμβεί μια τέτοια περίπτωση ( αδυναμία close hourly >2502-07) και κατόπιν σπασει το 2490 , μπορεί να βγεί ενα σετ σόρτ με στόπ new highs.

Με τις αναφερθείσες προϋποθέσεις και την διάσπαση του 90 και την μη επανάκτησή του , πάμε εν πρώτοις για την περιοχή 2450-55.

Tα new highs είναι στόπ και σε κάθε άλλη απόπειρα σόρτ.

Αν περάσει πάνω απο το 2513 , έχει το 2530.